
Monitor engagement in Viva Engage with analytics
Viva Engage provides robust analytics to help you better understand the impact of your posts. Analytics let you monitor:
-
Your own engagement (Personal, Answers, and Conversation analytics)
-
Engagement within the communities you visit (Community analytics)
Note: Except for conversation and community analytics, most dashboard analytics are only available to customers that have a Microsoft Viva Suite or Employee Communications and Communities license.
Open the Analytics dashboard
Analytics are visible to anyone who has created a post in Viva Engage and to leaders’ delegates.
Use any of these methods to open your personal analytics dashboard:
-
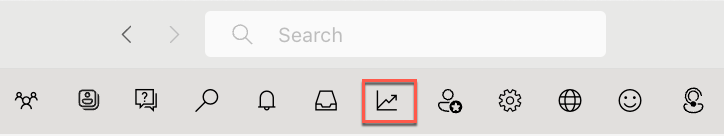
From the Viva Engage navigation bar, select the analytics icon.
-
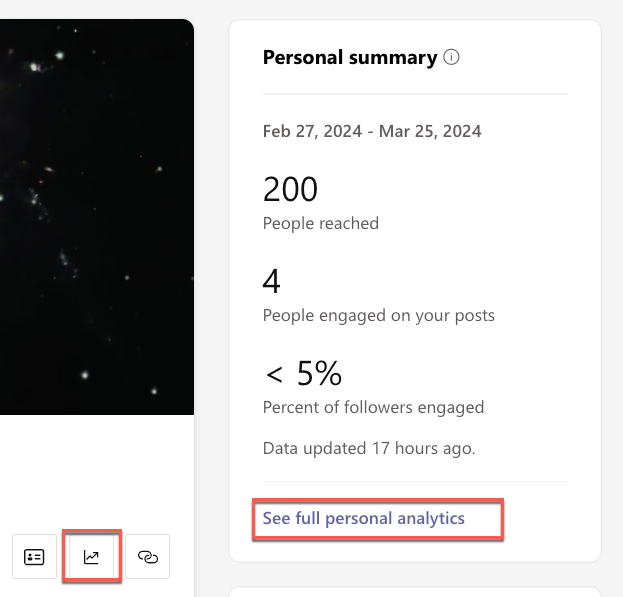
From your storyline, select the analytics icon below your cover photo or the link on the Personal summary tile.
-
From the Answers page, select the link on the Personal Answers summary tile.
Tip: Hover over a metric to get more information about the metric.
Expand for more details
Personal analytics include the following metrics:
|
Your reach |
A count of people who viewed, reacted or commented on your posts |
|
Reach breakdown |
A count of people who are viewing, reacting, or commenting |
|
Engaged breakdown |
The percentage of people who reacted or commented |
|
Top conversations |
The most popular conversations you have started |
|
Reactions to your posts |
A unique count of reactions on all your posts |
|
Top comments on your posts |
The comments on your posts with the most reactions |
To see trends, use these dashboard filters:
|
Date range |
Date range lets you see conversation trends starting from the date a post is created and beyond. Date ranges represent changes (deltas) for the selected period. You can filter on 7days, 28days, 90days, and 365days. For example, by selecting 7days, you can see the week-over-week change, whereas 90days shows quarter-over-quarter changes. |
|
Destination |
Use this filter to include data across communities and storyline, or only storyline. |
Note: Audience related metrics are only visible to leaders who have been identified by an admin or corporate communicator and have assigned audiences. For details, see Identify leaders and manage audiences in Viva Engage.
To understand the performance of questions and answers you engage with, view Answers analytics. These analytics are visible to anyone who has posted or answered a question in Engage, either on the Answers tab or in a community.
Answer analytics include the following metrics:
|
People you helped |
Your impact based on the number of people who engaged with a question you asked or answered. For details, see Answers in Viva: Understanding Time Saved & People Helped - Microsoft Community Hub |
|
Answers summary |
Analytics for questions you answered |
|
Questions summary |
Analytics for the questions you asked |
|
Questions you engaged in |
A breakdown of the most engaged questions you asked or answered |
Conversation analytics are a breakdown of Viva Engage post activity in real time and include data from conversation starters, articles, polls, praise, and more. Conversation analytics are visible to the post creators, their delegates, and corporate communicators. Community admins can view conversation analytics for the communities they manage.
-
Go to a conversation in Viva Engage, select the ellipse icon, and then select View analytics. Alternatively, select the Seen by count that appears on all threads.
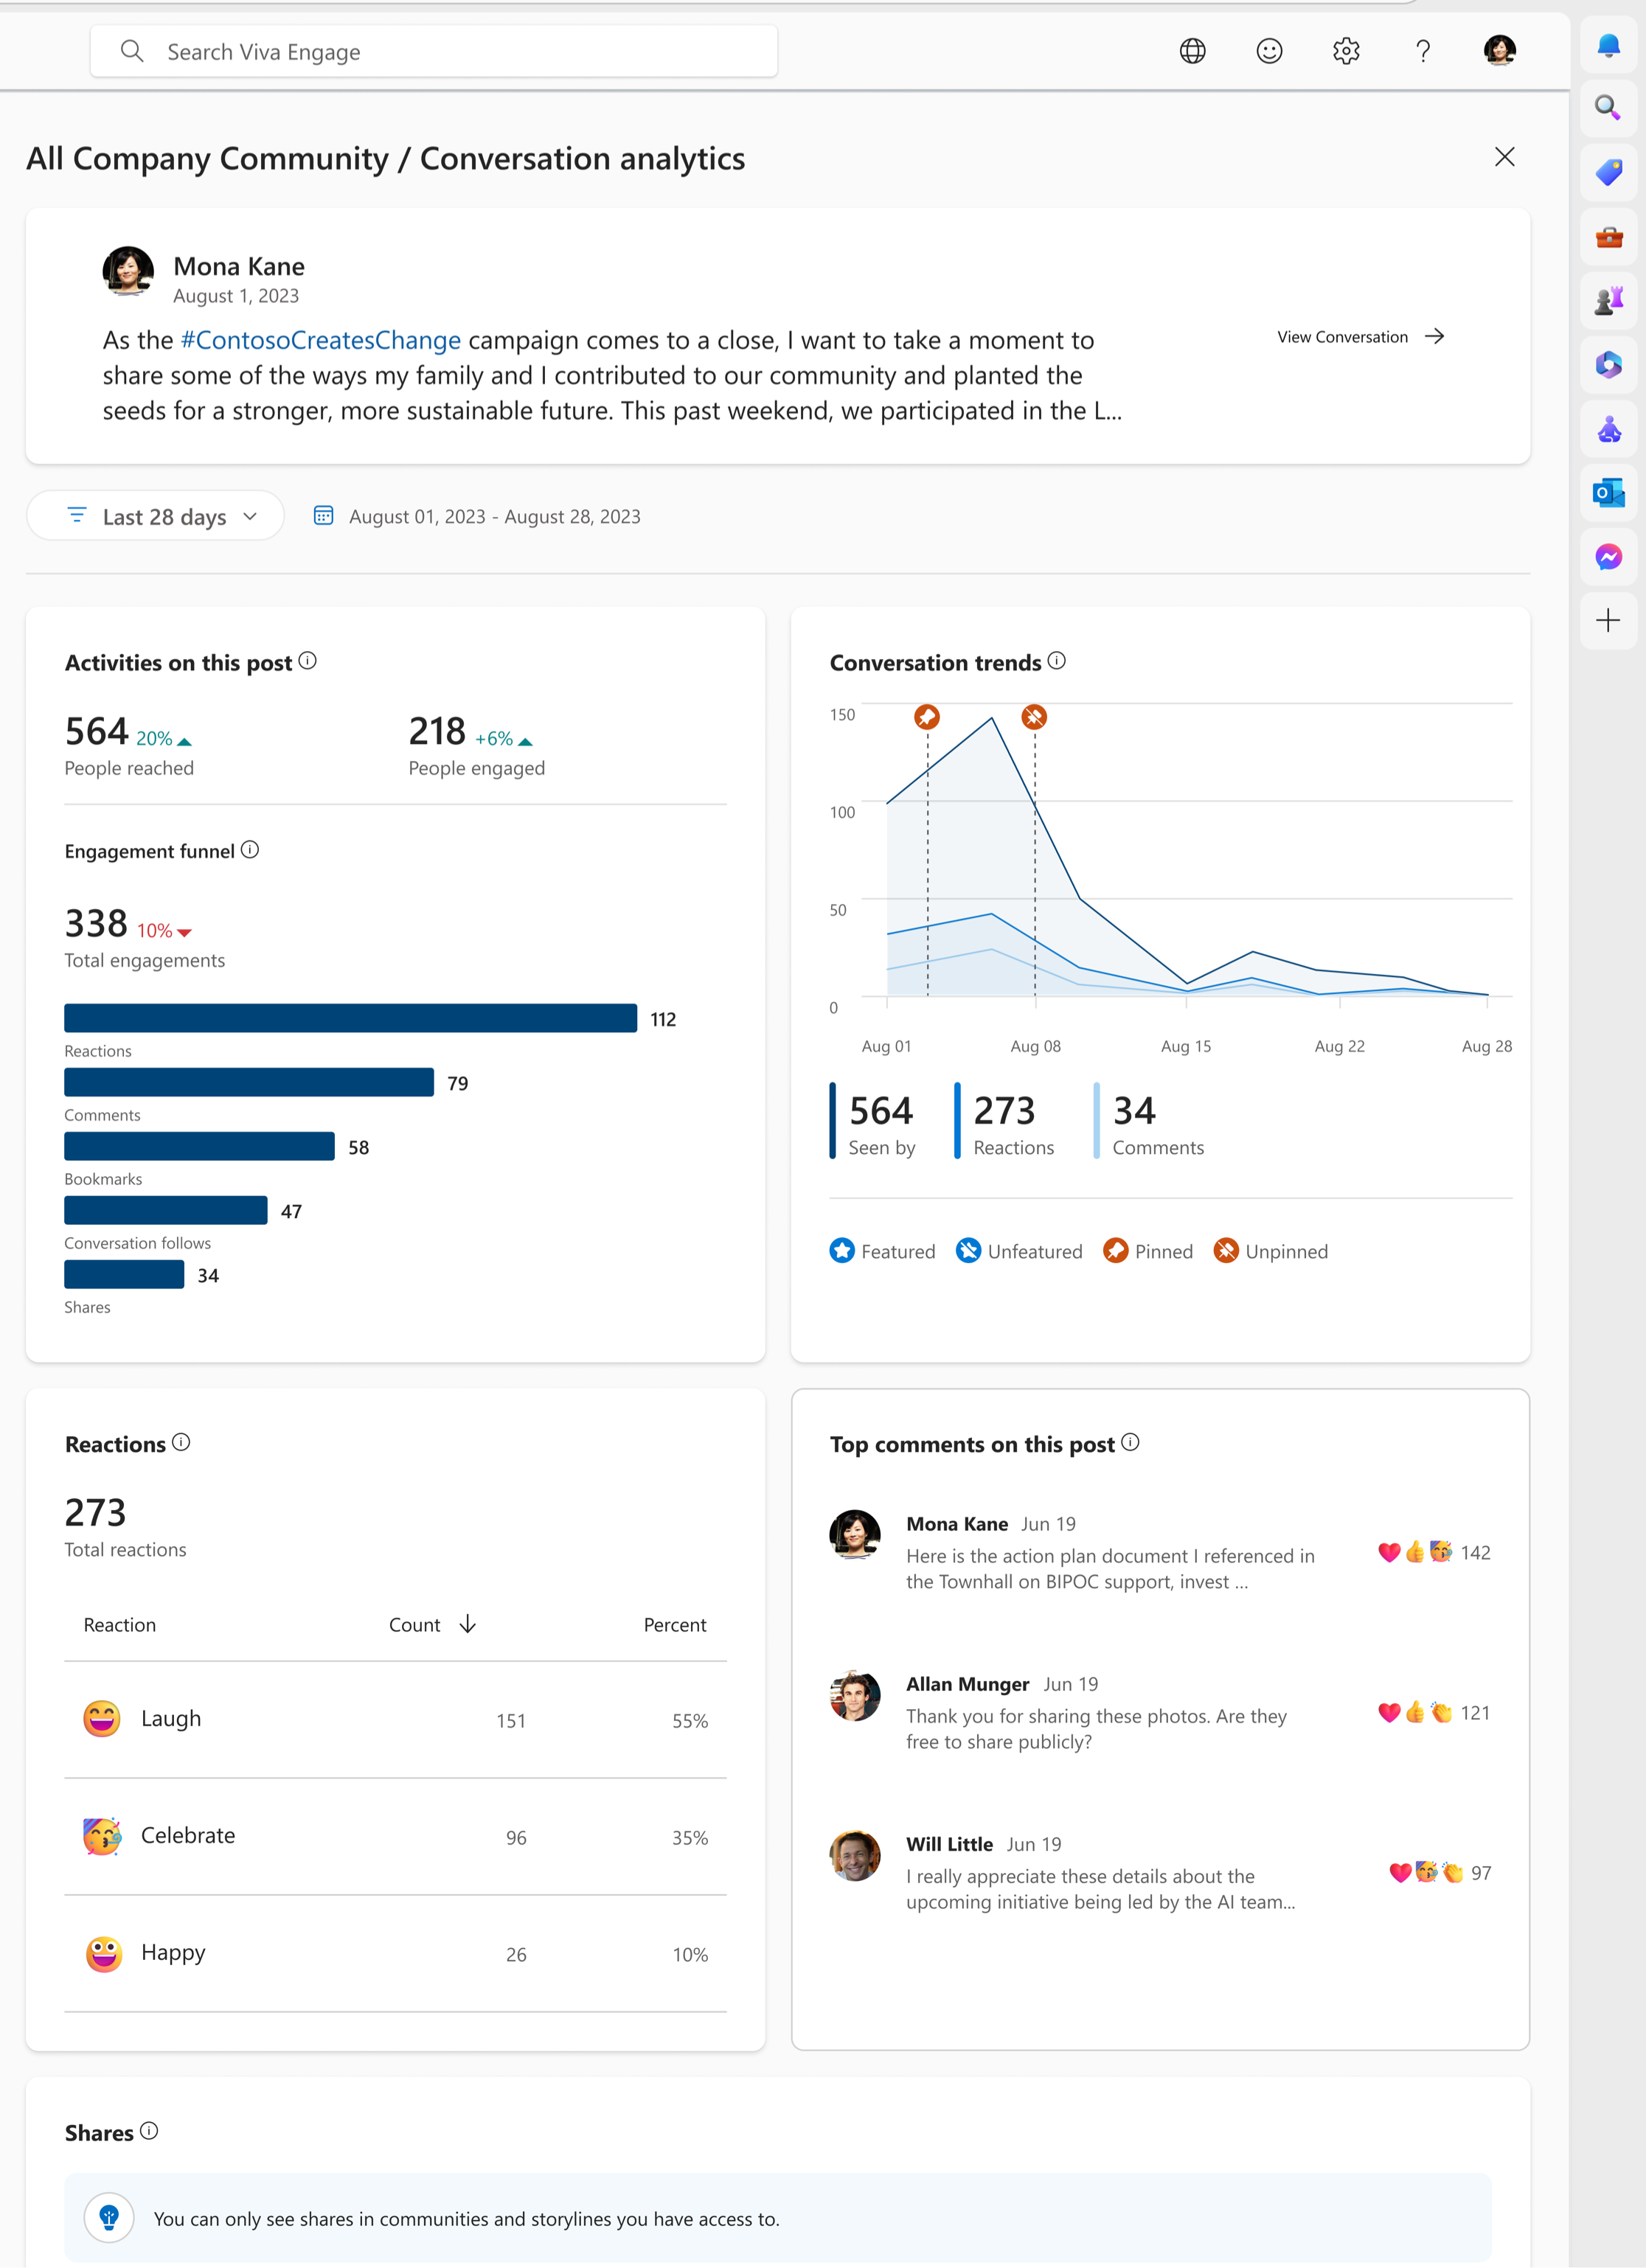
Conversation analytics include the following metrics:
|
People reached |
The number of people who viewed, reacted or replied |
|
People engaged |
The number of people who reacted or replied |
|
Engagement funnel |
The types of engagement happening on your post. Includes detailed conversation-specific activities like bookmarks and shares. |
|
Conversation trends |
Total users who have viewed, reacted and commented to the post in the selected time frame. In the case where a conversation has been featured or pinned, you'll see those actions represented in the graph. |
|
Reactions breakdown |
Total reactions and the type of reactions used |
|
Top comments on post |
An overview of the most engaged comments on the post |
|
Shares |
Shows how and where this post has been shared. Metrics in this table relate to the new post created upon share. |
Conversation analytics include these additional metrics in Viva Engage premium:
|
Advanced people reached and engaged |
Percentage of followers and the audience or community reached, depending on where the post is created. If a post is created within a community, community reach is displayed. If a post is created on storyline, followers reached is displayed. If the post is created on storyline by a leader, audience reached is displayed. |
|
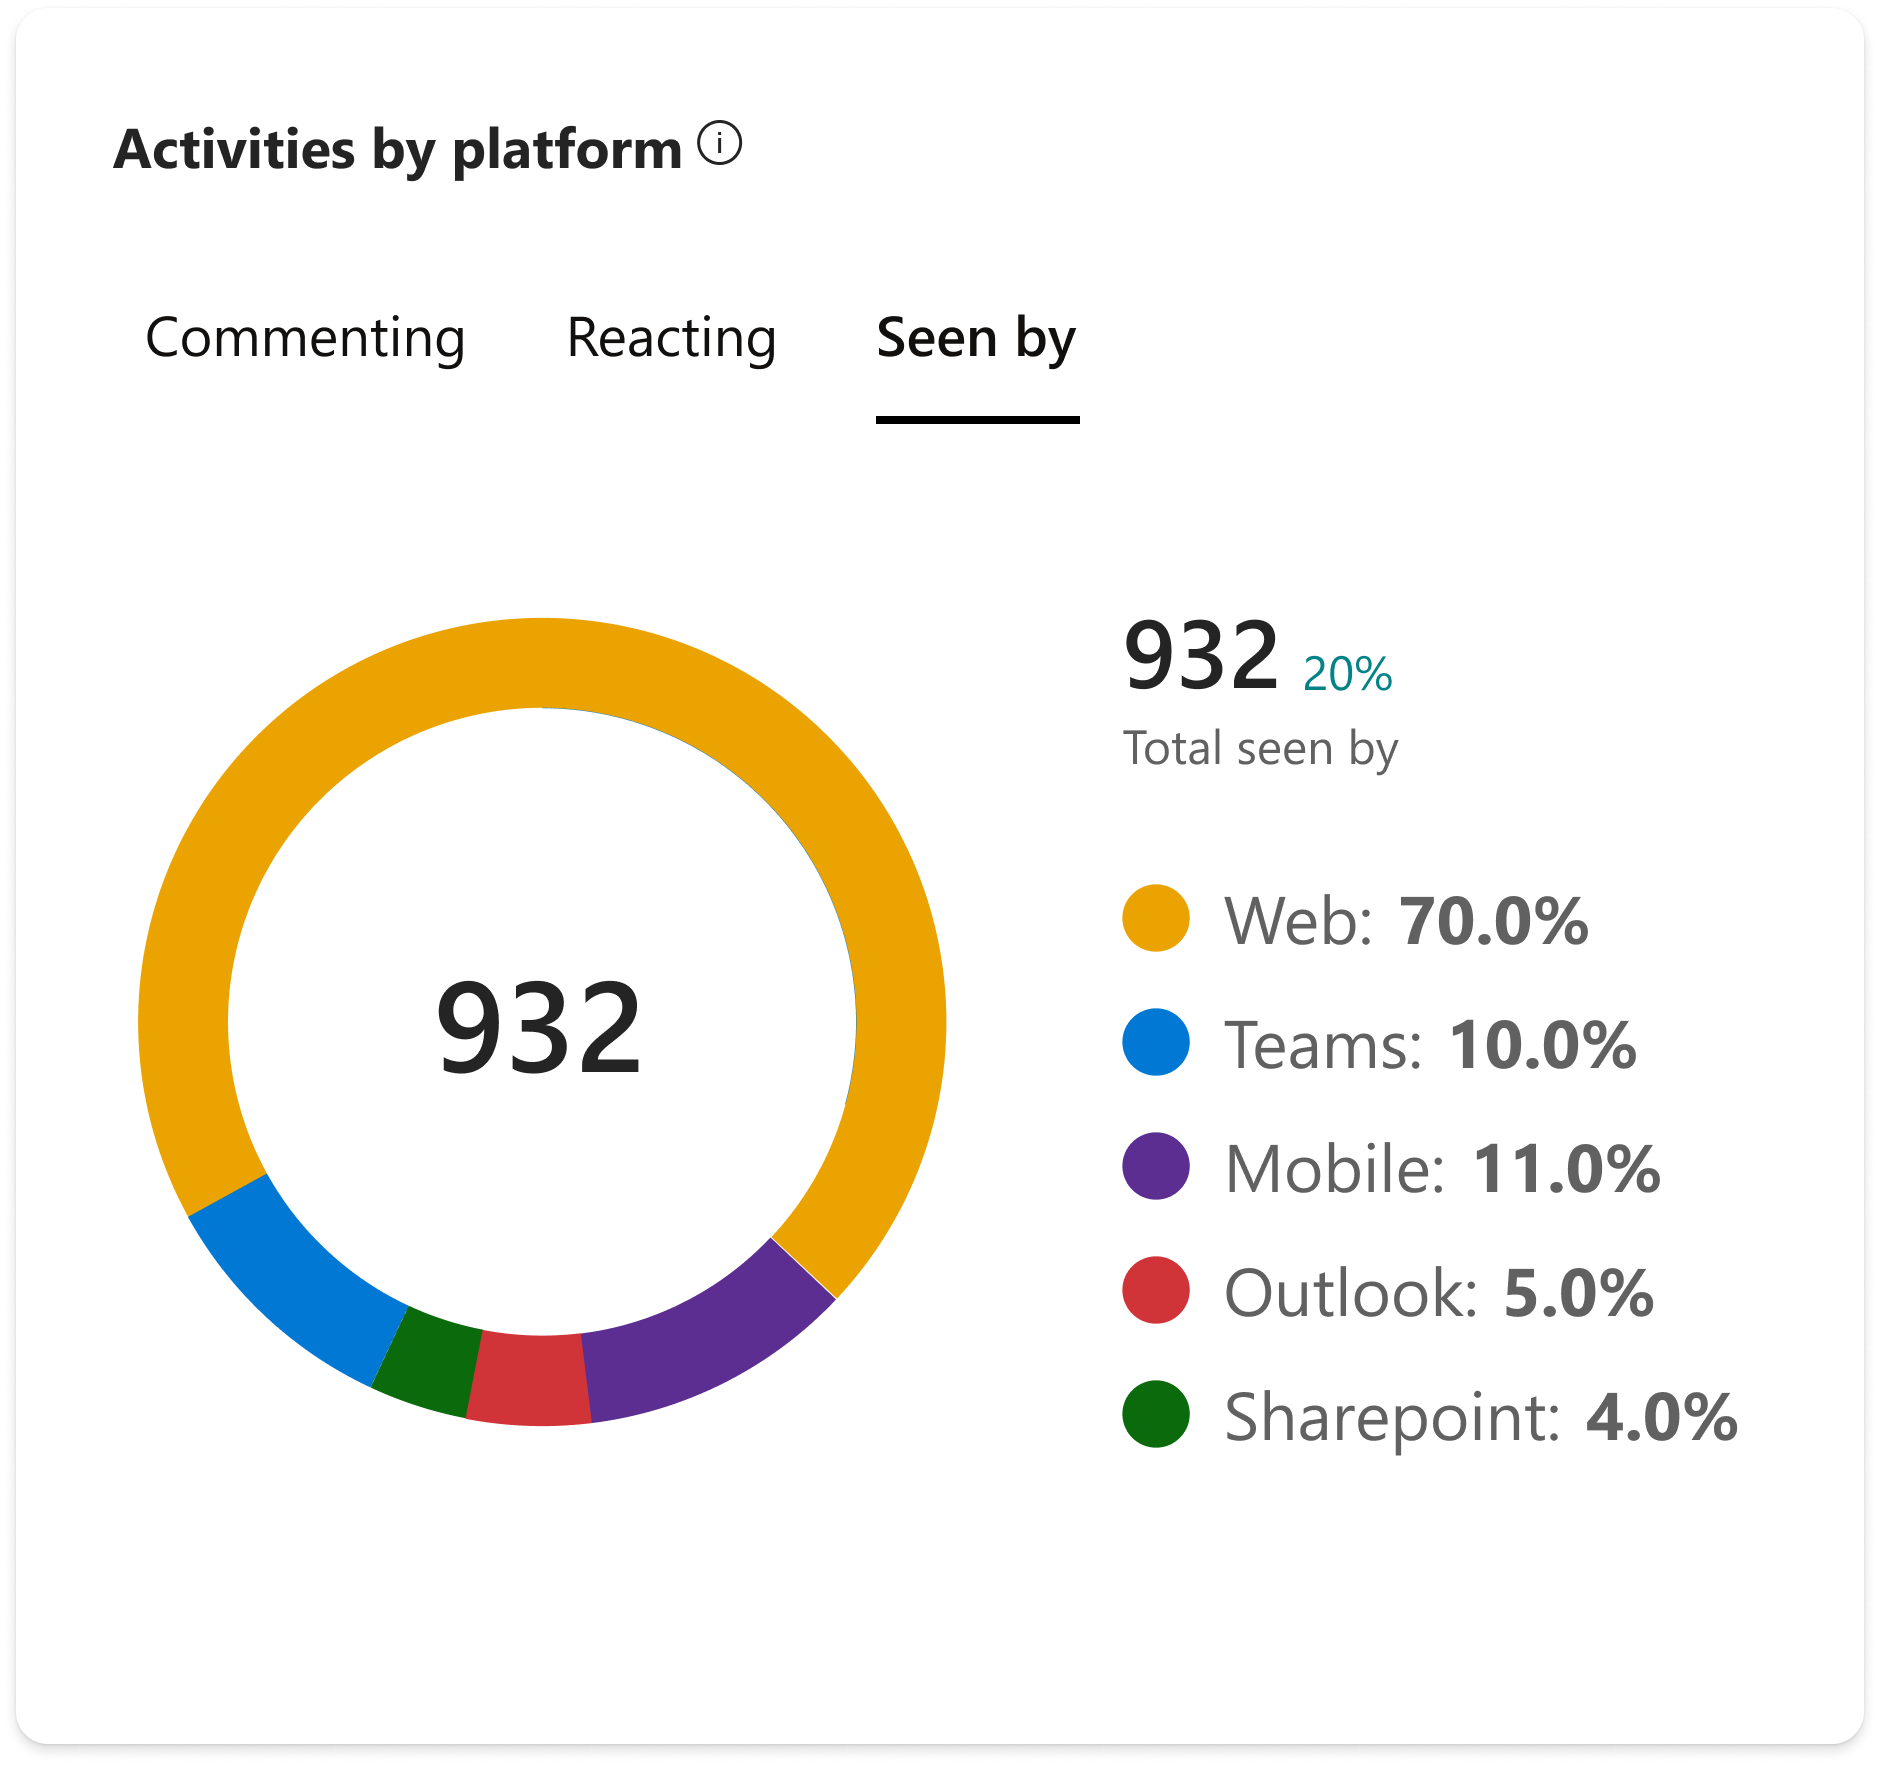
Activities by platform |
Platforms that comments, reactions, and views come from. |
|
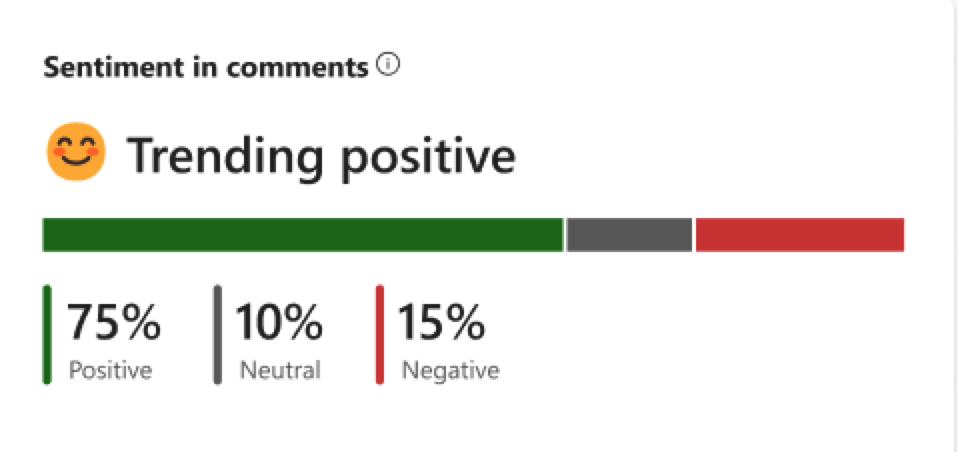
Sentiment in comments |
Average sentiment across all comments in post. This metric is only available on posts with at least five unique commentors. For details, see Sentiment and theme analysis in Viva Engage - Microsoft Support. |
Community analytics help community members and admins understand their Engage community’s engagement trends. Any member of the Viva Engage network can see insights for public communities. Community members can see insights for private communities. Community admins in premium licensed networks can see advanced analytics such as Time saved, People helped, Frequent contributors and Dormant conversations.
You can access community analytics by visiting a community and selecting the analytics icon in the community header. You can view community analytics through the Analytics hub, and then select the Community tab. Community admins can also see community analytics in a summary card visible on the right panel of their managed communities.
Community analytics include the following features and metrics definitions:
|
Date range selector |
All subsequent metrics apply to the selected date. |
|
Member activity |
Displays an overview of community member and admin activity. Member count doesn't include admins, so it may differ from the member count shown on the main community feed. |
|
Members/Admins/People Engaged |
Total unique users that reacted, commented or posted content in the community. |
|
Members/Admins/People Reached |
Total of unique users that viewed community content. |
|
Admin response rate |
Displays the rate of posts (thread starters) with community admin replies. |
|
Total posts |
Displays a breakdown of posts (thread starters) that were created within the community. |
|
Views on posts |
Displays counts of views across all posts (thread starters only). This count isn't unique, since a user can revisit a post and register as another view. |
|
Messages posted |
Displays the count of posted messages, including thread starters and replies. |
|
Reactions on messages |
Displays the count of reactions on messages, including thread starters and replies. |
|
Answer and Best answer rate |
Displays the percent of questions that receive answers, and the percent of questions marked as best answers within the community. |
|
Top conversations |
Displays the posts (thread starters) with the most reactions, comments and replies in the community. These conversations are only visible to admins, corporate communicators and members of the community. External guests and other external network users will not be authorized to see the contents in this table. |
|
Deltas |
All percent increase/decrease changes are based on the date selection. Examples: for 7-day periods, delta shows week over week changes. For 28-day periods, the delta shows month over month changes. |
Community analytics include additional metrics in Viva Engage Premium:
|
People helped |
Displays count of unique users who have reacted, voted and replied to Q&As within the community. |
|
Time saved |
Calculated based on research that answered questions save the average person approximately 15mins by reducing search times. |
|
Dormant conversations |
Displays community posts with no engagement. |
|
Unanswered questions |
Displays questions with no posted answers. |
|
Frequent contributors |
Displays users who create the most content within the community. |
|
New members |
Displays users who recently joined the community |
Note: You can export the data for any time range into a .CSV format file by selecting the Export button at the top of your community analytics dashboard.
Network analytics help network admins and corporate communicators understand how the Engage network is performing. For details on managing network analytics, see View and manage analytics in Viva Engage.
Network analytics include the following metrics:
|
People reached |
The number of people who viewed, reacted or replied |
|
People engaged |
The number of people who reacted or replied |
|
Engagement breakdown |
The types of engagement happening across your network. Engagement includes posts, comments, and reactions. Total engagements is an aggregate of all posts, comments, and reactions made during the selected period. |
|
Activities by platforms |
Shows the clients where activity occurs. If we don't have enough information to classify a client, an engagement is logged as Others. Similarly, if the exact client where engagement occurs isn’t logged in our data streams, we’ll log user activity as Others. An example of how this can happen is when an organization uses an API or embedding to expose the Engage feed to users. |
|
Posts and sentiment |
When AI Summarization is enabled, shows total users who have posted, total posts and sentiment trends across the content. For details, see Sentiment and theme analysis in Viva Engage - Microsoft Support. |
|
Trending themes in your network |
When AI Summarization is enabled, shows the most popular themes being discussed within your network. For details, see Sentiment and theme analysis in Viva Engage - Microsoft Support. |
|
Announcements breakdown |
An overview of announcement activity across your network includes location split of announcements made via storyline vs communities. Also shows overview of people reached, engaged, median time to first view and median time to first reaction for the selected period. |
|
Frequent contributors |
Shows who has created the most posts across the network. |
|
Top conversations |
Shows posts with the most activity. Can be sorted by views, reactions, comments or announcements only. |
|
Popular communities |
Shows communities with the most activity. Can be sorted by posts, comments, views per member and engaged members, defined as those who react or post a message within the community. |
|
Trending campaigns |
Shows campaigns with the most activity. Can be sorted by views, comments and reactions. |
Campaign analytics give Engage admins and corporate communicators performance metrics for official Engage campaigns. For details on managing these analytics, see View community insights in Viva Engage.
Campaign analytics tracks the following metrics:
|
People reacted |
The number of people who reacted to a post with the campaign hashtag. |
|
People commented |
The number of people who commented on a post with the campaign hashtag. |
|
People posted |
The number of people who created a post using the campaign hashtag |
|
People reached |
The number of people who viewed, reacted or replied to a post using the campaign hashtag |
|
Followers |
The number of people who follow a campaign |
|
Total posts |
Shows how many posts included a campaign hashtag out of the total number of posts made. List can be sorted by location of most posts or location with most views. |
|
Top conversations |
Shows the conversations with the most activity. Can be sorted by views, comments, or reactions. |
|
Campaign followers breakdown |
Shows engagement funnel of campaign followers, including totals of their follows and activities. Some categories won't display with fewer than five participants. Can be filtered to view activity of only the leader (as defined on Engage). |
|
Reactions from people |
Shows total reaction split by reaction type. |
Learn more


Need more help?
Want more options?
Explore subscription benefits, browse training courses, learn how to secure your device, and more.


Communities help you ask and answer questions, give feedback, and hear from experts with rich knowledge.


