
Digital engagement data in Education Insights Premium
See an overview of digital engagement across your organization with Education Insights Premium. View your Digital engagement dashboard to focus on key metrics of student learning in Microsoft Teams for Education, such as class meeting attendance, assignment completion statuses, and engagement with classmates and educators.
Digital engagement dashboard
Your Digital engagement data can reflect different levels of your education organization: district, school, or grade level, depending on your permissions.
From your dashboard, you can:
-
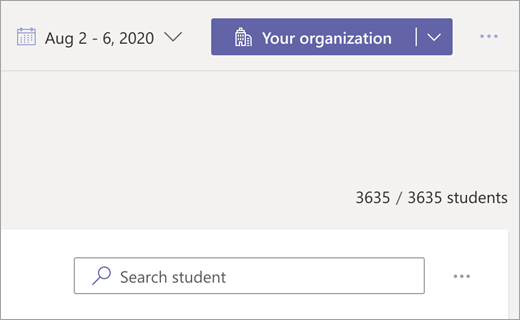
View and change which organization level you're viewing
-
Use the dropdown to select a different level if needed
-
-
The number of students out of the organization the dashboard is showing in a given view, depending on the hierarchy selected
-
Search for an individual student
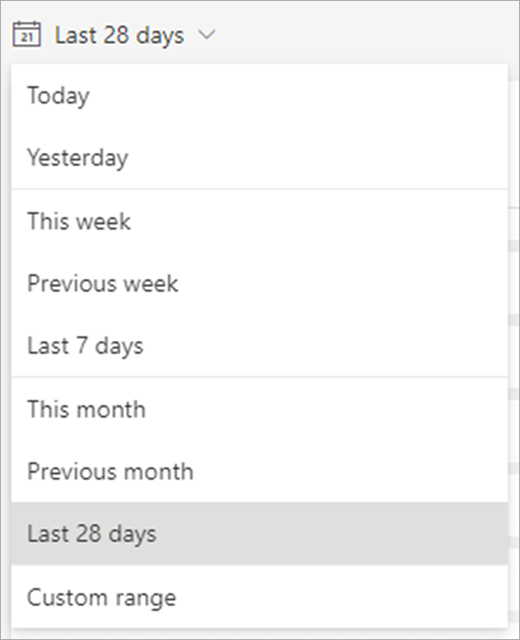
View data from a specific timeframe
Time filter: select 
-
Select Custom range to enter your own dates for a timeframe of up to 60 days. Timeframes can begin as far back as the beginning of the academic year, as determined by SDS.
Note: Percentage data is calculated only for students on the roster the last day of any timeframe you select. If there is no roster data for the timeframe selected, the default timeframe may change accordingly.
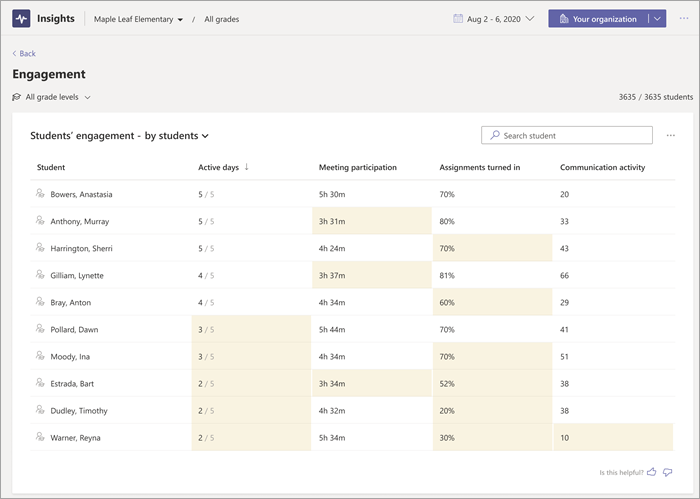
Read your data
Once you've selected the timeframe and organization level you want, you can view the following data:
-
Active days: Number of days of activity out of the total days in the selected time frame.
-
Meeting participation: Time spent in class meetings
-
Assignments turned in: Percentage of due assignments that were turned in
-
Communication activity: Number of posts made
Dashboard tips
Data totals vs. averages
If you're viewing data about specific students, the calculations will be totals of each student's activity. For data views across schools, grades, or classes, you'll see averages across all students.
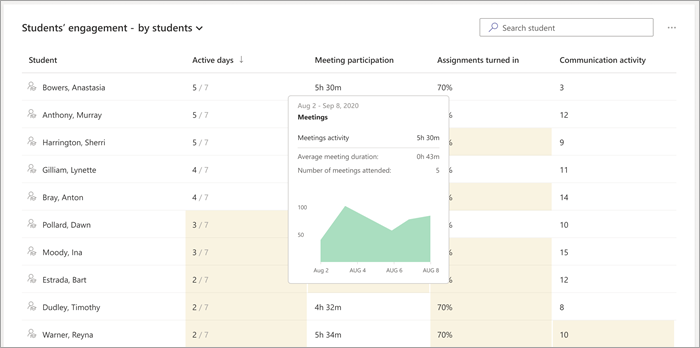
See more details for a data point
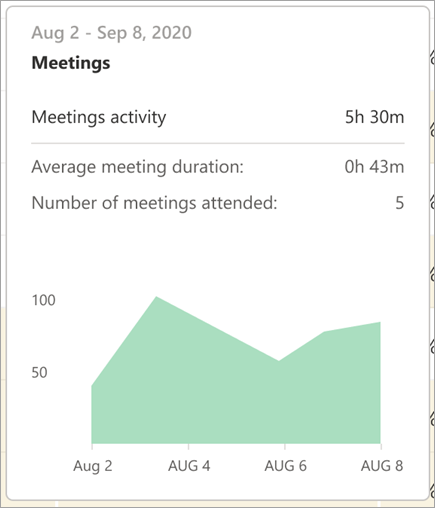
Select a specific data point within any category to view more details. For example, if your dashboard is filtered to show data by individual student, under the Meeting participation category you could select the 5h 30m data point—showing total meeting participation for the selected time frame— for one student's meeting participation and get more details, like how many meetings they attended, which days the data is coming from, and average meeting duration.
Learn More


Need more help?
Want more options?
Explore subscription benefits, browse training courses, learn how to secure your device, and more.


Communities help you ask and answer questions, give feedback, and hear from experts with rich knowledge.


