
Using Power Query data with Python in Excel
Python in Excel is currently in preview and is subject to change based on feedback. To use this feature, join the Microsoft 365 Insider Program and choose the Beta Channel Insider level.
Python in Excel is currently available in Excel for Windows using the Beta Channel. At this time, the feature is not available in Excel for Mac and Excel on the web.
If you encounter any issues with Python in Excel, please report them by selecting Help > Feedback in Excel.
New to Python in Excel? Start with Introduction to Python in Excel and Getting started with Python in Excel.
What is Power Query?
Power Query is a data transformation and preparation tool designed to help you shape your data, and it’s available in Excel and other Microsoft products.
Use Power Query with Python in Excel to import external data into Excel and then analyze that data with Python. Python in Excel can only run calculations on data in an Excel workbook or data imported with Power Query.
To learn more about Power Query, see Power Query for Excel Help.
How to use Power Query to import data for Python in Excel
To import data from external sources, use Power Query. Take the following steps to learn how to import a sample external data set and use it with Python in Excel.
Tip: If you’re already familiar with Power Query and want to work with existing queries in your workbook, skip to Step 6.
-
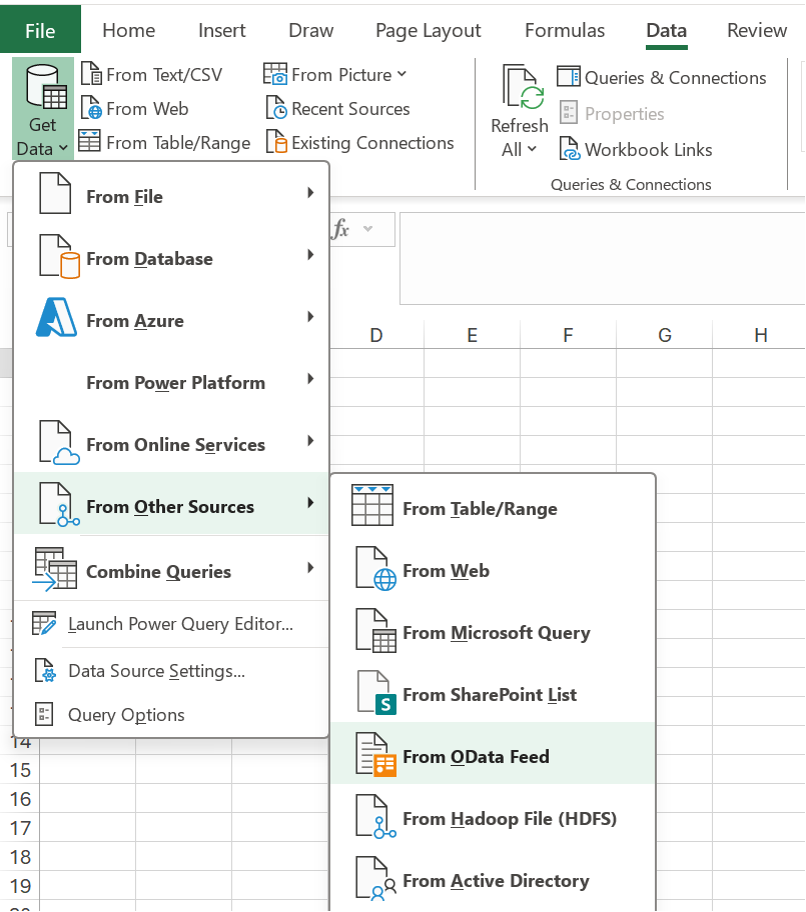
First, select the Data tab on the ribbon to see the Get & Transform Data and Queries & Connections groups. Choose Get Data to select your data source. You can import data from multiple sources, including CSV (comma-separated values) files. Every import creates a query. For this example, let’s import data from the Northwind OData service, a test data source. After selecting Get Data, select From Other Sources, and then From OData Feed. The following screenshot shows this path in the Excel UI.
-
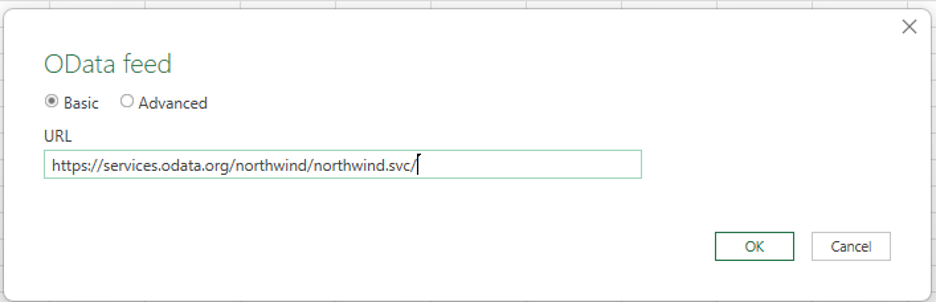
Next, enter the following link to the Northwind OData service and select OK.
https://services.odata.org/northwind/northwind.svc/ The following screenshot shows the OData feed dialog in the Excel UI.
-
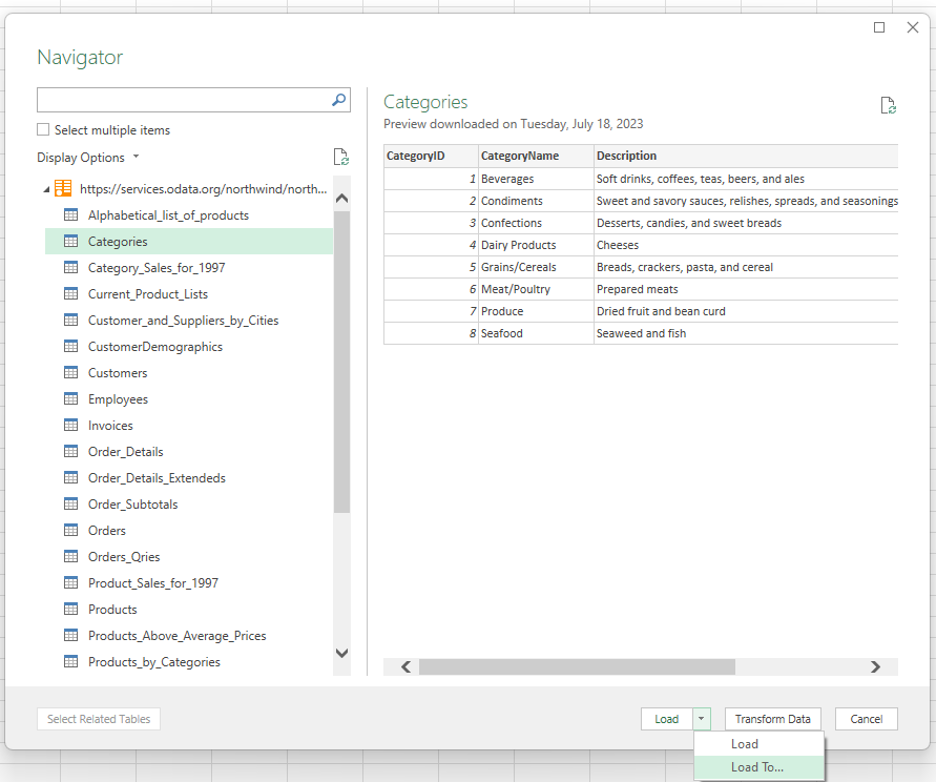
In the Power Query preview dialog, select a data table to load into Excel. For this example, select the Categories table, and then select the down arrow next to the Load button and choose Load To... The following screenshot shows the Power Query preview dialog with the Categories table selected and the Load To... option displayed.
Notes:
-
You can also select Transform Data from the Power Query preview dialog. This allows you to edit the data in the Power Query Editor before importing it into Excel.
-
If you want to view the data on the Excel grid, select the Load button. This will load the selected table directly to the Excel grid.
-
-
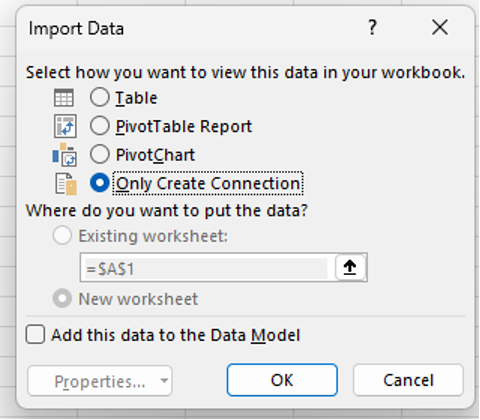
Select Only Create Connection to establish the data connection from the source. Power Query automatically creates a query for this connection.
-
The Queries & Connections pane opens automatically, listing the query created by Power Query for the selected data source — in this case, the Categories table from the Northwind OData sample dataset. You can manually open the Queries & Connections pane by selecting Data > Queries & Connections in the Excel ribbon.
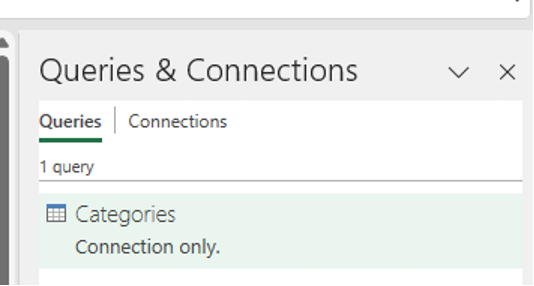
Tip: Hover over the queries in the task pane to get a preview of the data.
-
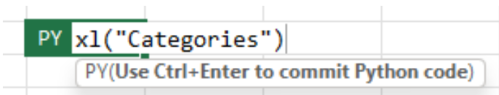
To work with external data with Python in Excel, enable Python in a cell by entering the =PY function. Next, use the Python in Excel xl() formula to reference Excel elements, like a Power Query query. For this example, enter xl("Categories") into the Python in Excel cell. The following screenshot shows a Python in Excel cell containing the xl("Categories") formula. Use Ctrl+Enter to commit the Python code.
-
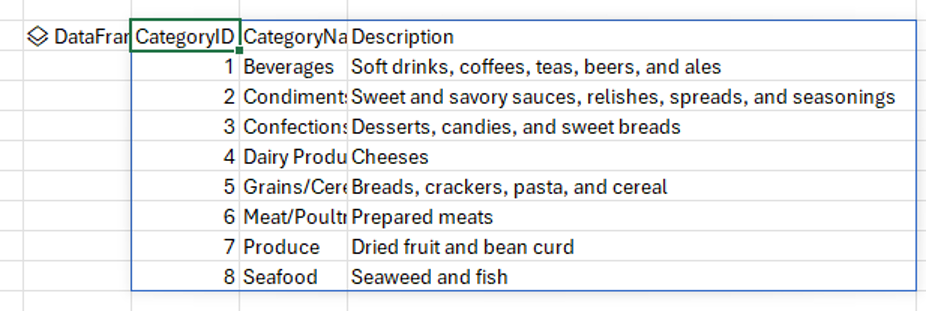
The Python cell now displays the Categories data within a DataFrame, as returned by the xl("Categories") formula. The following screenshot shows the Categories data returned in the Python cell.
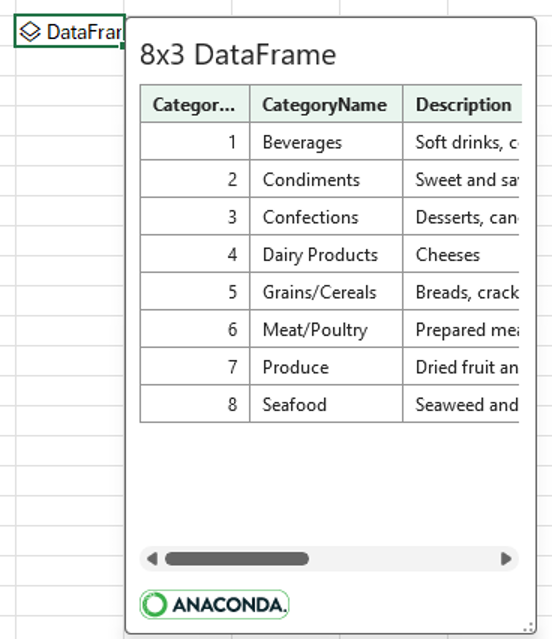
Tip: Resize the DataFrame dialog using the icon in the bottom right corner.
-
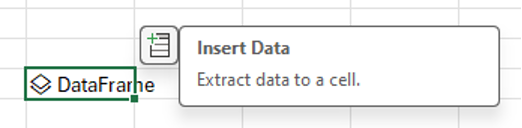
Convert the data in the DataFrame to Excel values, which returns the data to the Excel grid. To convert the DataFrame to Excel values, select the cell containing the DataFrame, and then select the Insert Data icon. The following screenshot shows an example of this icon next to the DataFrame.
-
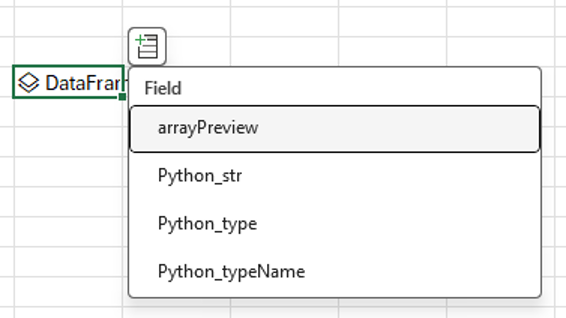
Select the first value in the menu, arrayPreview. This value displays the Python data from the DataFrame in the Excel grid. See the following screenshot for an example.
-
Now that you’ve used Power Query to import external data and processed that data with Python in Excel, you’re ready to start analyzing data with Python in Excel.
Related articles
Introduction to Python in Excel


Need more help?
Want more options?
Explore subscription benefits, browse training courses, learn how to secure your device, and more.


Communities help you ask and answer questions, give feedback, and hear from experts with rich knowledge.


