

Try it!
Create a PivotTable to summarize and analyze your data in a structured format. PivotCharts are a great way to add data visualizations to your data.
|
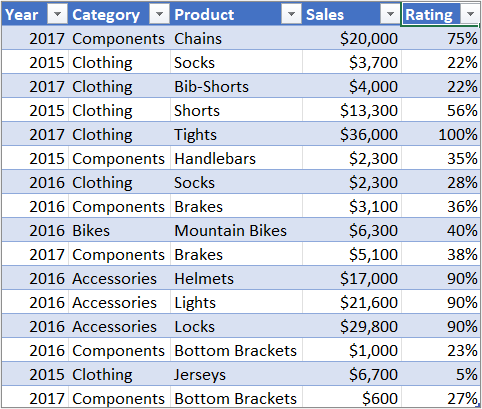
Household expense data |
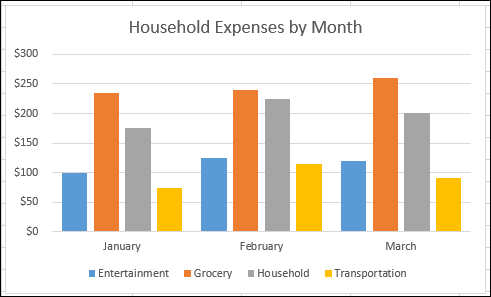
Corresponding PivotChart |
|
|
|
Create a PivotChart
-
Select a cell in your table.
-
Select Insert > PivotChart

-
Select OK.
Create a chart from a PivotTable
-
Select a cell in your table.
-
Select PivotTable Tools > Analyze > PivotChart
-
Select a chart.
-
Select OK.
Want more?


Need more help?
Want more options?
Explore subscription benefits, browse training courses, learn how to secure your device, and more.


Communities help you ask and answer questions, give feedback, and hear from experts with rich knowledge.


